Note
Go to the end to download the full example code.
Using AIC and BIC for Model Selection#
This example will demonstrate how the Akaike Information Criterion (AIC) and Bayesian Information Criterion (BIC) values may be used to select the number of components for a model.
We train models with varying numbers of
n_components.For each
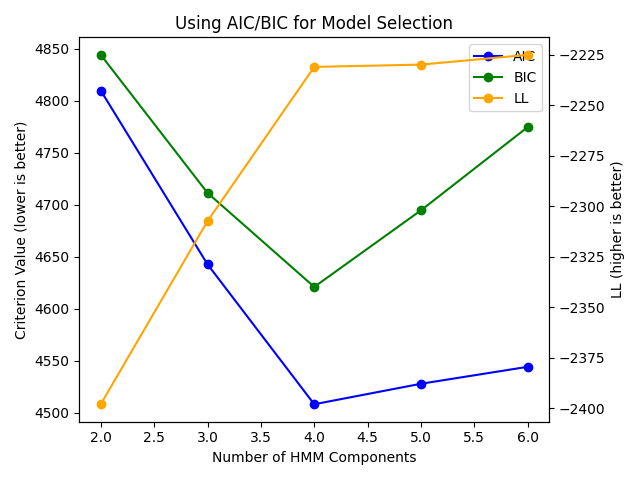
n_componentswe train multiple models with different random initializations; the best model is kept.Now we plot the values of the AIC and BIC for each n_components. A clear minimum is detected for the model with
n_components=4. We also see that using the log-likelihood of the training data is not suitable for model selection, as it is always increasing.
import numpy as np
import matplotlib.pyplot as plt
from sklearn.utils import check_random_state

from hmmlearn.hmm import GaussianHMM

rs = check_random_state(546)
Our model to generate sample data from:
model = GaussianHMM(4, init_params="")
model.n_features = 4
model.startprob_ = np.array([1/4., 1/4., 1/4., 1/4.])
model.transmat_ = np.array([[0.3, 0.4, 0.2, 0.1],
                            [0.1, 0.2, 0.3, 0.4],
                            [0.5, 0.2, 0.1, 0.2],
                            [0.25, 0.25, 0.25, 0.25]])
model.means_ = np.array([[-2.5], [0], [2.5], [5.]])
model.covars_ = np.sqrt([[0.25], [0.25], [0.25], [0.25]])

X, _ = model.sample(1000, random_state=rs)
lengths = [X.shape[0]]
Search over various n_components and examine the AIC, BIC, and the LL of the data. Train a few different models with different random initializations, saving the one with the best LL.
aic = []
bic = []
lls = []
ns = [2, 3, 4, 5, 6]
for n in ns:
    best_ll = None
    best_model = None
    for i in range(10):
        h = GaussianHMM(n, n_iter=200, tol=1e-4, random_state=rs)
        h.fit(X)
        score = h.score(X)
        if not best_ll or best_ll < score:
            best_ll = score
            best_model = h
    aic.append(best_model.aic(X))
    bic.append(best_model.bic(X))
    lls.append(best_model.score(X))
Visualize our results: a clear minimum is seen for 4 components which matches our expectation.
fig, ax = plt.subplots()
ln1 = ax.plot(ns, aic, label="AIC", color="blue", marker="o")
ln2 = ax.plot(ns, bic, label="BIC", color="green", marker="o")
ax2 = ax.twinx()
ln3 = ax2.plot(ns, lls, label="LL", color="orange", marker="o")

ax.legend(handles=ax.lines + ax2.lines)
ax.set_title("Using AIC/BIC for Model Selection")
ax.set_ylabel("Criterion Value (lower is better)")
ax2.set_ylabel("LL (higher is better)")
ax.set_xlabel("Number of HMM Components")
fig.tight_layout()

plt.show()
Total running time of the script: (0 minutes 13.740 seconds)